Weather Graphs
Our latest stats
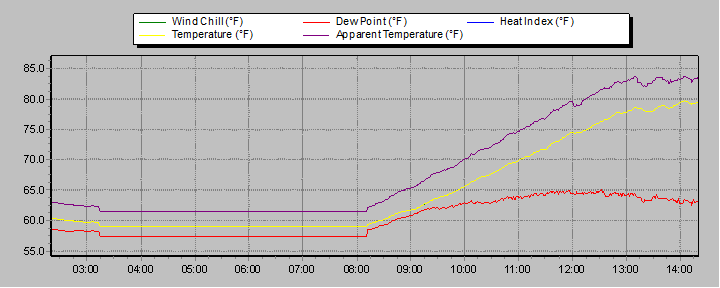
These graphs present temperature, pressure, rainfall, and wind speed trends for the last 12 hours.
The thumbnail graphs are sampled every ten minutes. Click on a thumbnail to display the corresponding larger graph in the panel above it. The large graphs are sampled every minute.
Click on a thumbnail to show a large graph above.


Update: 12/24/2025 2:30:01 PM